Showing posts with label jobs. Show all posts

Wednesday, November 16, 2011

Jobs Situation in the Midwest 2011 vs 2010

From the BLS: Among metropolitan areas in the 12 states of the Midwest region, the largest over-the-year employment increases from September 2010 to September 2011 occurred in Chicago-Joliet-Naperville, Illinois (+21,100), followed by Minneapolis-St. Paul-Bloomington (+20,100), and Milwaukee-Waukesha-West Allis, Wisconsin, (+17,400).
Among metropolitan areas in the Midwest, 28 reported over-the-year decreases in nonfarm payroll employment, 62 reported increases, and 3 had no change in September 2011.
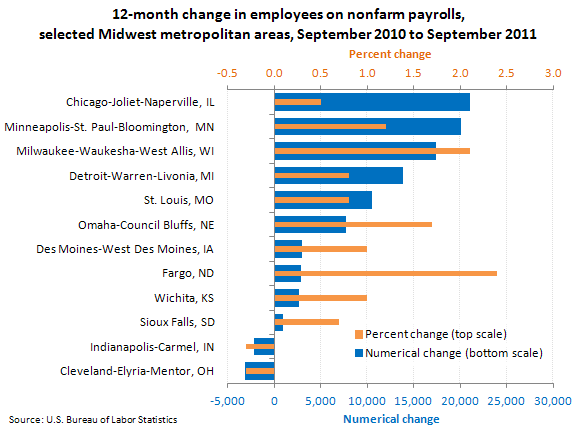
Sandusky, Ohio, reported an over-the-year percentage gain in employment of 7.0 percent (one of the nation's largest). St. Joseph, Missouri, recorded the largest percentage decrease in employment among metropolitan areas in the Midwest (−4.0 percent).
Among large metropolitan areas (metropolitan areas with annual average employment levels above 750,000 in 2010), two in the Midwest each had large over-the-year percentage decreases in employment: Cleveland-Elyria-Mentor, Ohio, and Indianapolis-Carmel, Indiana (−0.3 percent each).
Bismarck, North Dakota, recorded the lowest unemployment rate in the Midwest (2.5 percent), followed by Fargo, North Dakota (3.3 percent), and Lincoln, Nebraska (3.5 percent).
Ames, Dubuque, and Iowa City (all in Iowa), Mankato-North Mankato, and Rochester (both in Minnesota), Omaha-Council Bluffs (Nebraska), Grand Forks (North Dakota), and Rapid City, and Sioux Falls (both in South Dakota) all recorded unemployment rates between 4.0 and 5.0 percent in September.
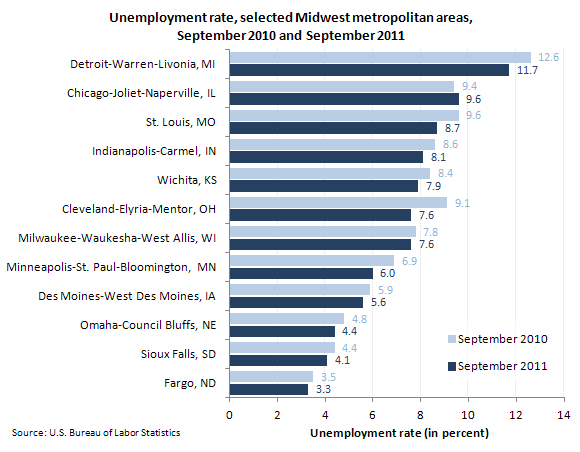
September's highest unemployment rates in Midwest metropolitan areas were recorded in Rockford, Illinois (13.4 percent), Detroit-Warren-Livonia, Michigan (11.7 percent), and Kankakee-Bradley, Illinois (11.2 percent).

The Midwest BLS Information Office in Chicago has links to more data for the states of Illinois, Indiana, Iowa, Michigan, Minnesota, Nebraska, North Dakota, Ohio, South Dakota, and Wisconsin (which are all included in the Midwest region). The Mountain-Plains BLS Information Office in Kansas City services the states of Kansas and Missouri (which are included in the Midwest region), as well as Colorado, Montana, Utah, and Wyoming.

Sunday, November 13, 2011

Oil Jobs in North Dakota

Thanks to the oil boom going on in North Dakota, there are plenty of jobs to be had in the state. Truck drivers are making $80,000 per year. Fast food workers are making at least $15/hour. A licensed electrician called 4 companies and got 4 job offers in 2 hours... One of the downfalls is that there isn't enough housing for all the nomads that are migrating to the city.

Monday, September 5, 2011

How tough is it to find work?

Yahoo News has put out an interesting article today that puts into perspective just how hard the 14 million unemployed Americans are having finding a job. Not only are they competing with other unemployed folks for open positions but also almost 9 million underemployed folks who are looking to switch from unrewarding part-time jobs into meaningful full-time employment. Additionally, both segments have to fight against people with full-time work that are looking to switch jobs or employers. With the nation's unemployment rate holding steady at 9.1% and the European situation getting worse, many companies are getting slightly more cautious as they see the current turmoil causing increasing uncertainty and therefore, they are a little more hesitant to invest new capital or to create new jobs. Many people are even running out of unemployment benefits after their 99 weeks have run out. How difficult has it been for you to find work?

Monday, February 8, 2010

More Women Working than Men


As Econompicdata shows for the first time in US history there are more women with jobs than men. This is one reason why the current great recession has been called a mancession. As many industries that have been dominated by males (construction and manufacturing) have been hit quite hard by lay-offs and job-losses, while many industries dominated by women (education and health-care) have not suffered as extreme of a hit to their payrolls.

For additional reading on the subject, you can check out The NY Times or Casey Mulligan's Blog (he's a professor at the University of Chicago).

Friday, February 5, 2010

January Jobs Report---Unemployment drops to 9.7%


CNBC reports in this 10 minute video clip the January, 2010 jobs report. The Unemployment rate is at 9.7%. The unemployment declined because of the benchmark revisions and because more people were finding work.

Annual benchmark revisions show 8.4 million jobs lost since the start of the recession versus 7.2 million prior to the revision.

Rick Santelli commented that,the benchmark revision was in the realm of expectations, and he wants to know how much the labor force shrank / (grew) in the period.

The average work week was higher at 33.3 hours per week versus 33.2 hours per week prior to the report.

Temporary jobs continue to increase, but construction jobs continue to decline.

In February and March, government employment is expected to increase as the census starts its 2010 hiring spree.

Mark Zandi views the decline in unemployment rate confusing, because payroll employment continues to shrink (ADP data), so how could unemployment be improving?

In order to stabilize employment, analysts say 125,000 jobs per month need to be created---However, this past month 20,000 jobs were still destroyed. While the trend is still improving, things aren't fully positive yet.

Thursday, February 4, 2010

Trucking Jobs have Dropped During the Recession


The >Bureau of Labor Statistics has recently issued a study that shows how employment in the truck transportation industry has dropped from 1.45 million jobs before 2008 to about 1.25 million trucking jobs by the end of 2009. This decrease of 200,000 drivers is significant not only for the truckers, but also for the manufacturers and merchants that sell the goods that these guys deliver.


You can see in the above chart that the severity of the decline in this recession (Green Line) is much steeper and prolonged than what it was in the prior two recessionary periods.

Wednesday, January 6, 2010

ADP Jobs Report shows an Increase in Service Jobs

This morning ADP reported that overall jobs were down 84,000 last month, but the service sector actually saw an increase in jobs.

Jake at economPic Data created the chart below that nicely shows how it has been well over a year since the service industry was a net producer of jobs on a month-on-month basis.

Unfortunately, manufacturing has steadily been dropping drops for years & years.


Click on Chart for a Larger Image.

If you wish to read the entire ADP December 2009 Jobs report, click here.

Thursday, December 10, 2009

Who is (or isn't) Counted as Unemployed?


This little 2 minute video does a good job in explaining how the Bureau of Labor Statistics measures who is Unemployed, who is not in labor market, who is marginally in the labor market and who is working part time for economic reasons.

Only people who are "Unemployed" are counted in the (10%) unemployment rate. The other 3 categories may or may not be included in the U-6 Broader measurement of unemployment (~17%). The video pokes fun that the government would rather have the public and media focus on the smaller number in order to keep optimism high.

Wednesday, December 2, 2009

Do I get 99 weeks of unemployment?

According to the Wall Street Journal, the maximum amount of unemployment insurance jobless Americans can now receive is 99 weeks---That's almost 2 years of benefits while you're looking to get a new job!

In order to get the additional 20 weeks, your state would need to have had an unemployment rate in excess of 8.5% during the previous 3 months.

Tuesday, November 24, 2009

Minimum Wage Goes Up, Teen Employment Goes Down

Economist Casey Mulligan has an interesting blog-post on how the recent increase in the minimum wage rate has measurably reduced the amount of teenagers that have jobs.

Michigan's U-6 Unemployment over 20%

According to mlive the broader level of unemployment in Michigan is over 21%.

For the 12 months from November 2008 to October 2009, Michigan had 21.1% of workers either out of a job, or working part time for economic reasons.

Of Michigan's 83 counties, unemployment ranges from ~6% (Mackinac) to ~25% (Baraga County).

California Has Lost 1 million+ Jobs in this Recession

For the movie buffs out there, you may remember the classic movie "Grapes of Wrath" where people who lost their jobs in the dust-bowl drying up agriculture jobs in the midwest loaded everybody up in the car to head to California---Land of jobs and opportunity---Unfortunately, there weren't plentiful opportunities once they got to the golden state.

If you look at data for our Nation's most populous state, you'll see that for the first time ever it has more than 2.2 million people out of jobs (This doesn't include the likely 1 million more who are working part-time jobs even though they want full time work). According to the Bureau of Labor Statistics, in just a few short years the jobless ranks more than doubled from less than 1 million to greater than 2 million.


One thing to note however, is that from 1976 to 2009---The state of California has seen a huge increase in population and hence a big increase in the size of its labor force. In fact over 33 years, it has increased almost 80% from less than 10 million workers to around 18 million workers.

The unemployment rate is just the # of jobless workers divided by the labor force---As you can see, California is seeing record high unemployment rates of 12.5% as of October 2009.
Click on Charts for Larger Image

What is interesting to note is that from April 2009 to October 2009, the BLS thinks that California's labor force dropped by almost 300,000 workers---If you think cynically and say that those people probably really are still in California and not working---The unemployment rate in October would have been closer to 13.9% in California...

Tuesday, November 17, 2009

Detroit's Unemployment Rate is ~28%


Click on Chart for a Larger Image

According to statistics released by the state of Michigan and BLS.gov the state of Michigan had an unemployment rate of 15.3% in September 2009, while jobs in Detroit were twice as difficult to find --- as its jobless rate from September 27.9%.

While you might find it comforting that Detroit's unemployment rate dropped from July 2009 to September; you'll be interested to know that during the same time the labor force shrunk by 8,000 people from 391,000 to 383,000. And the number of people employed dropped from 278,000 in July to 276,000 in September----So in other words, the number of jobs is still on the decline---it's just that the work force was declining at a faster rate.

Disappearing Jobs

A hat tip to the the Great Depression of 2006 blog for posting a link to this video graphic that shows the US unemployment by county for the trailing 12 month average from 2007 to the present.

Latoya Egwuekwe is the creator of the multimedia graphic that shows you just how quickly and how broadly that jobs disappeared from the Midwestern, Eastern, Southern and Western parts of the US. And since the graphic shows the rolling 12 month average, you can rest assured that the next 4 - 6 months will be showing even more of the US losing jobs.


Friday, October 16, 2009

Florida's Jobless Rate Spikes to 11%

According to the Jacksonville Observer, the unemployment rate in Florida has now breached the 11% mark.

It is the highest unemployment rate for the sunshine state since 1975, and it's up over 4 percentage points in the one year since September 2008.

Fort Walton Beach, Gainesville and Tallahassee – regions known for government, education and military employment – had the lowest unemployment rates, all less than 7.5 percent.

Wednesday, September 30, 2009

Where are the Jobs?

If you're trying to figure out where the jobs are, indeed.com does a report that shows you what cities currently have the most job postings per capita in United States.

The Top 20 Cities for Job Searches are:
Rank (Last Qtr Rank) Metropolitian AreaJob Postings Per 1000 People
1 (1) Washington, DC133
2 (2) Baltimore, MD90
3 (3) San Jose, CA80
4 (7) Austin, TX56
5 (6) Hartford, CT54
6 (9) Seattle, WA53
7 (8) Salt Lake City, UT52
8 (11) Denver, CO50
9 (5) Boston, MA49
10 (4) Las Vegas, NV49
11 (15) Charlotte, NC49
12 (10) San Francisco, CA47
13 (12) Milwaukee, WI41
14 (30) Atlanta, GA40
15 (13) Cincinnati, OH39
16 (14) Oklahoma City, OK39
17 (22) Orlando, FL37
18 (23) Richmond, VA37
19 (24) Jacksonville, FL36
20 (16) Dallas, TX36

meanwhile the 10 major cities with the fewest jobs per capita are:
40 (44) St. Louis, MO30
41 (39) Portland, OR30
42 (42) New York, NY28
43 (41) Birmingham, AL28
44 (46) Chicago, IL27
45 (43) Riverside, CA26
46 (45) Los Angeles, CA24
47 (47) Buffalo, NY24
48 (48) Rochester, NY19
49 (49) Miami, FL17
50 (50) Detroit, MI15

It probably isn't surprising that Detroit has the fewest jobs per person, and that Washington DC has the most jobs per person. Government jobs and lobbying jobs are in demand as the government runs the printing press to try and save jobs and support the economy. Meanwhile Detroit, LA, Miami, and Chicago are having slimmer pickings.

Tuesday, September 8, 2009

What are the Top Paying Jobs?

If you're looking at what are the highest paying jobs for graduates from college you should consider engineering, economics or physics.

Payscale.com has put out a comprehensive list for people by college major (not counting people who have attained a graduate degree). You can see what people currently earn (1 or 2 out of college) and what they earn after ~15 years out of school (i.e. graduated around 1995). It may not surprise you, but the more quantitative the field of study, the more opportunity there is for a higher income.

For many of today's unemployed, this is not a possibility, but if you have a child in high school or college, this is important data that you can provide them when they are trying to decide what major to study.

Thursday, June 25, 2009

Decade of Lost Jobs

Business Week recently published data that shows how many jobs were created and lost by industry during the last decade (May 1999 to May 2009).

The data is plotted below

Click image for a larger chart

What is most noticable is that 5.4 million jobs were lost in the American manufacturing sector---This is a result of cheaper foreign labor driving more Americans from the goods-producing sector and into the service sector.

In total, a little over 3 million jobs were created---With 2.9 million of thoes jobs coming from Private Health Care... It's easy to understand why---health care inflation has significantly outpaced overall inflation for the entire decade, and with the aging baby boomers---more and more people are qualifying for government care---People go to where the money is and money is in health care.

Tuesday, May 26, 2009

5 Unemployed Workers for Every 1 Job Opening

Jake at EconoPicData has published this very interesting chart (shown above) that is a neat way of showing what I blogged about a month ago concerning that there are 5 unemployed job seekers out there for every single job opening.

Jake's way of showing the data is a bit more visually pleasing compared to my way---but the point is clear---the amount of unemployed Americans continues to grow, while the numbers of available jobs continue to shrink. And as Jake notes this could possibly to a future wave of stagfaltion---as inflation increases commodity prices, yet workers are unable to generate wage growth---because at the margin, there's so many more people willing to do work now than what there was just a couple of years ago.

Tuesday, May 19, 2009

Only 1 in 5 new college graduates have found a job

CNN's Josh Lev reports on the difficulties that college graduates are having in finding jobs.

According to the stats, only 20% of college graduates who applied for jobs got a job offer in 2009 (vs. 51% in 2007)---And only 25% of college graduates are planning on going to graduate school.

The majors that are having the easiest time finding jobs are engineering and accounting undergrads.