Showing posts with label Chicago. Show all posts

Wednesday, November 16, 2011

Jobs Situation in the Midwest 2011 vs 2010

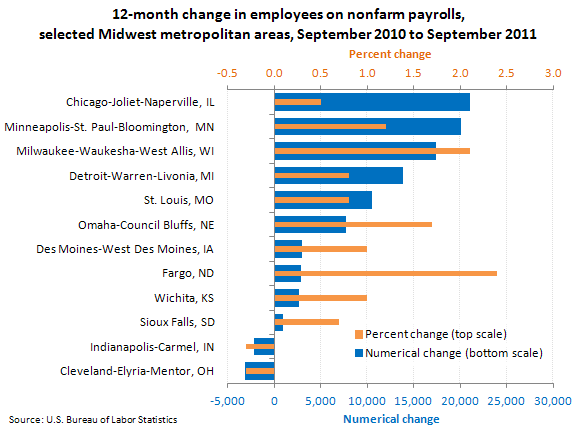
From the BLS: Among metropolitan areas in the 12 states of the Midwest region, the largest over-the-year employment increases from September 2010 to September 2011 occurred in Chicago-Joliet-Naperville, Illinois (+21,100), followed by Minneapolis-St. Paul-Bloomington (+20,100), and Milwaukee-Waukesha-West Allis, Wisconsin, (+17,400).
Among metropolitan areas in the Midwest, 28 reported over-the-year decreases in nonfarm payroll employment, 62 reported increases, and 3 had no change in September 2011.
Sandusky, Ohio, reported an over-the-year percentage gain in employment of 7.0 percent (one of the nation's largest). St. Joseph, Missouri, recorded the largest percentage decrease in employment among metropolitan areas in the Midwest (−4.0 percent).
Among large metropolitan areas (metropolitan areas with annual average employment levels above 750,000 in 2010), two in the Midwest each had large over-the-year percentage decreases in employment: Cleveland-Elyria-Mentor, Ohio, and Indianapolis-Carmel, Indiana (−0.3 percent each).
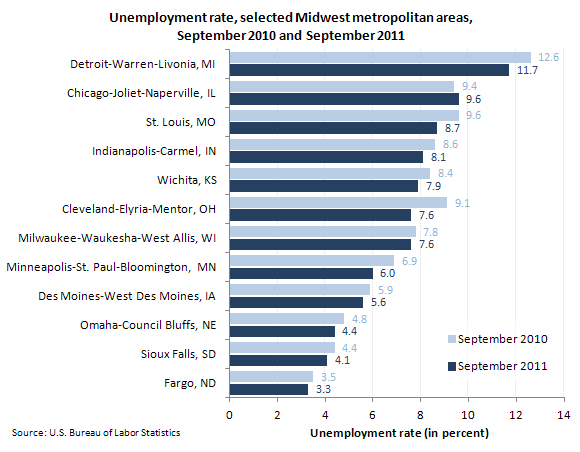
Bismarck, North Dakota, recorded the lowest unemployment rate in the Midwest (2.5 percent), followed by Fargo, North Dakota (3.3 percent), and Lincoln, Nebraska (3.5 percent).
Ames, Dubuque, and Iowa City (all in Iowa), Mankato-North Mankato, and Rochester (both in Minnesota), Omaha-Council Bluffs (Nebraska), Grand Forks (North Dakota), and Rapid City, and Sioux Falls (both in South Dakota) all recorded unemployment rates between 4.0 and 5.0 percent in September.
September's highest unemployment rates in Midwest metropolitan areas were recorded in Rockford, Illinois (13.4 percent), Detroit-Warren-Livonia, Michigan (11.7 percent), and Kankakee-Bradley, Illinois (11.2 percent).

The Midwest BLS Information Office in Chicago has links to more data for the states of Illinois, Indiana, Iowa, Michigan, Minnesota, Nebraska, North Dakota, Ohio, South Dakota, and Wisconsin (which are all included in the Midwest region). The Mountain-Plains BLS Information Office in Kansas City services the states of Kansas and Missouri (which are included in the Midwest region), as well as Colorado, Montana, Utah, and Wyoming.
Sunday, November 13, 2011

Chicago's Unemployment Rate is Above 10%

The unemployment rate is still above 10% in the Chicago metro-area. It has been elevated for almost 2 years and significantly higher than the 4% unemployment rate around 2000... With that many people out of work, I'm surprised more people aren't taking part in the Occupy Wall Street protests held around LaSalle Street and Grant Park...

Wednesday, September 30, 2009

Where are the Jobs?

If you're trying to figure out where the jobs are, indeed.com does a report that shows you what cities currently have the most job postings per capita in United States.

The Top 20 Cities for Job Searches are:
Rank (Last Qtr Rank) Metropolitian AreaJob Postings Per 1000 People
1 (1) Washington, DC133
2 (2) Baltimore, MD90
3 (3) San Jose, CA80
4 (7) Austin, TX56
5 (6) Hartford, CT54
6 (9) Seattle, WA53
7 (8) Salt Lake City, UT52
8 (11) Denver, CO50
9 (5) Boston, MA49
10 (4) Las Vegas, NV49
11 (15) Charlotte, NC49
12 (10) San Francisco, CA47
13 (12) Milwaukee, WI41
14 (30) Atlanta, GA40
15 (13) Cincinnati, OH39
16 (14) Oklahoma City, OK39
17 (22) Orlando, FL37
18 (23) Richmond, VA37
19 (24) Jacksonville, FL36
20 (16) Dallas, TX36

meanwhile the 10 major cities with the fewest jobs per capita are:
40 (44) St. Louis, MO30
41 (39) Portland, OR30
42 (42) New York, NY28
43 (41) Birmingham, AL28
44 (46) Chicago, IL27
45 (43) Riverside, CA26
46 (45) Los Angeles, CA24
47 (47) Buffalo, NY24
48 (48) Rochester, NY19
49 (49) Miami, FL17
50 (50) Detroit, MI15

It probably isn't surprising that Detroit has the fewest jobs per person, and that Washington DC has the most jobs per person. Government jobs and lobbying jobs are in demand as the government runs the printing press to try and save jobs and support the economy. Meanwhile Detroit, LA, Miami, and Chicago are having slimmer pickings.

Tuesday, April 28, 2009

Cool new Google Charts plot Unemployment Rates by State or County

Leave it to the engineers at Google to come up with yet another pretty cool thing.

Now if you search google for something like, "unemployment rate in California" or "Unemployment Rate in Cook County, IL" (see below), the first result will be a little thumb-nail of a chart---If you click on that, it goes to a google chart--using public data to chart the unemployment rate.


The tool is very easy to use, and lets you even compare the unemployment by USA, any state, or any US County.

So if you're curious---go to google.com and search for Unemployment Rate in XXXX to see the charts for yourself.


Friday, February 27, 2009

Major Cities Continue to See Unemployment Rate Increases

According to Data from the Bureau of Labor Stats some of the nation's largest metro areas continue to see increases in their unemployment rate.

Currently, Data is only available up until December 2008--When the Nation's Unemployment rate was 7.2%---As of January, 2009 the US's unemployment rate was 7.6%---So If I had to guess, I'd say that most of these city's unemployment rates are really ~0.5% higher than what is currently shown.

Click for a Larger Image

Of the 5 cities shown, Las Vegas has the highest unemployment rate in December, of 9.1% as gamblers and conventioneers continue to limit their trips to sin-city.

Los Angeles Metro Area saw an 8.8% unemployment rate and Atlanta was at 7.6%.

Chicago (7.1%) and New York (6.6%) Metro areas saw unemployment rates below the national average in the month of December.

Sunday, January 11, 2009

Expect City by City unemployment rates to worsen

Even though the BLS issued its report earlier this week that the national unemployment rate is at 7.2%, it will be several weeks before they issue data by state & city. So the best they currently have to offer by city is for November-2008 (During which the US unemployment rate was 6.8%.
You can see that Washington DC had only 4.4% unemployment rate, Boston 5.0%, and Houston and Phoenix were both at 5.5%.

Miami was at 6.4% unemployed, Chicago at 6.5%; And Los Angeles came in at 8.1% and Detroit at 9.5%.

Seeing as how the national unemployment rate increased by 50bps since the November reports (from which these cities were pulled), don't be surprised if most of these cities increased by 0.5% themselves once more data is published

Friday, December 19, 2008

Comparing the unemployment rates of New York City, Chicago, LA, Las Vegas, and Atlanta

So I decided to take a look at the unemployment rate by major metropolitan area for several of the US's big cities---New York City, Los Angeles, Las Vegas, Chicago, and Atlanta. It's important to note that since this is at the metro-level (rather than national or state level), the unemployment rates are 'lumpier' --- just as a result of statistical sampling techniques used for each geography.


But in general you can see some trends, LA and Las Vegas have seen the steepest increase in unemployment rate during the last 2 years---followed by Atlanta & Chicago. And the diverse New York City economy seems to be holding in there a little bit better than its peers.